1. Women in parliament
The proportion of women representatives in the world’s national parliaments stood at 24.2% at the end of 2019, including both upper and lower chambers. This visualization shows how far there is still to go to reach equality.
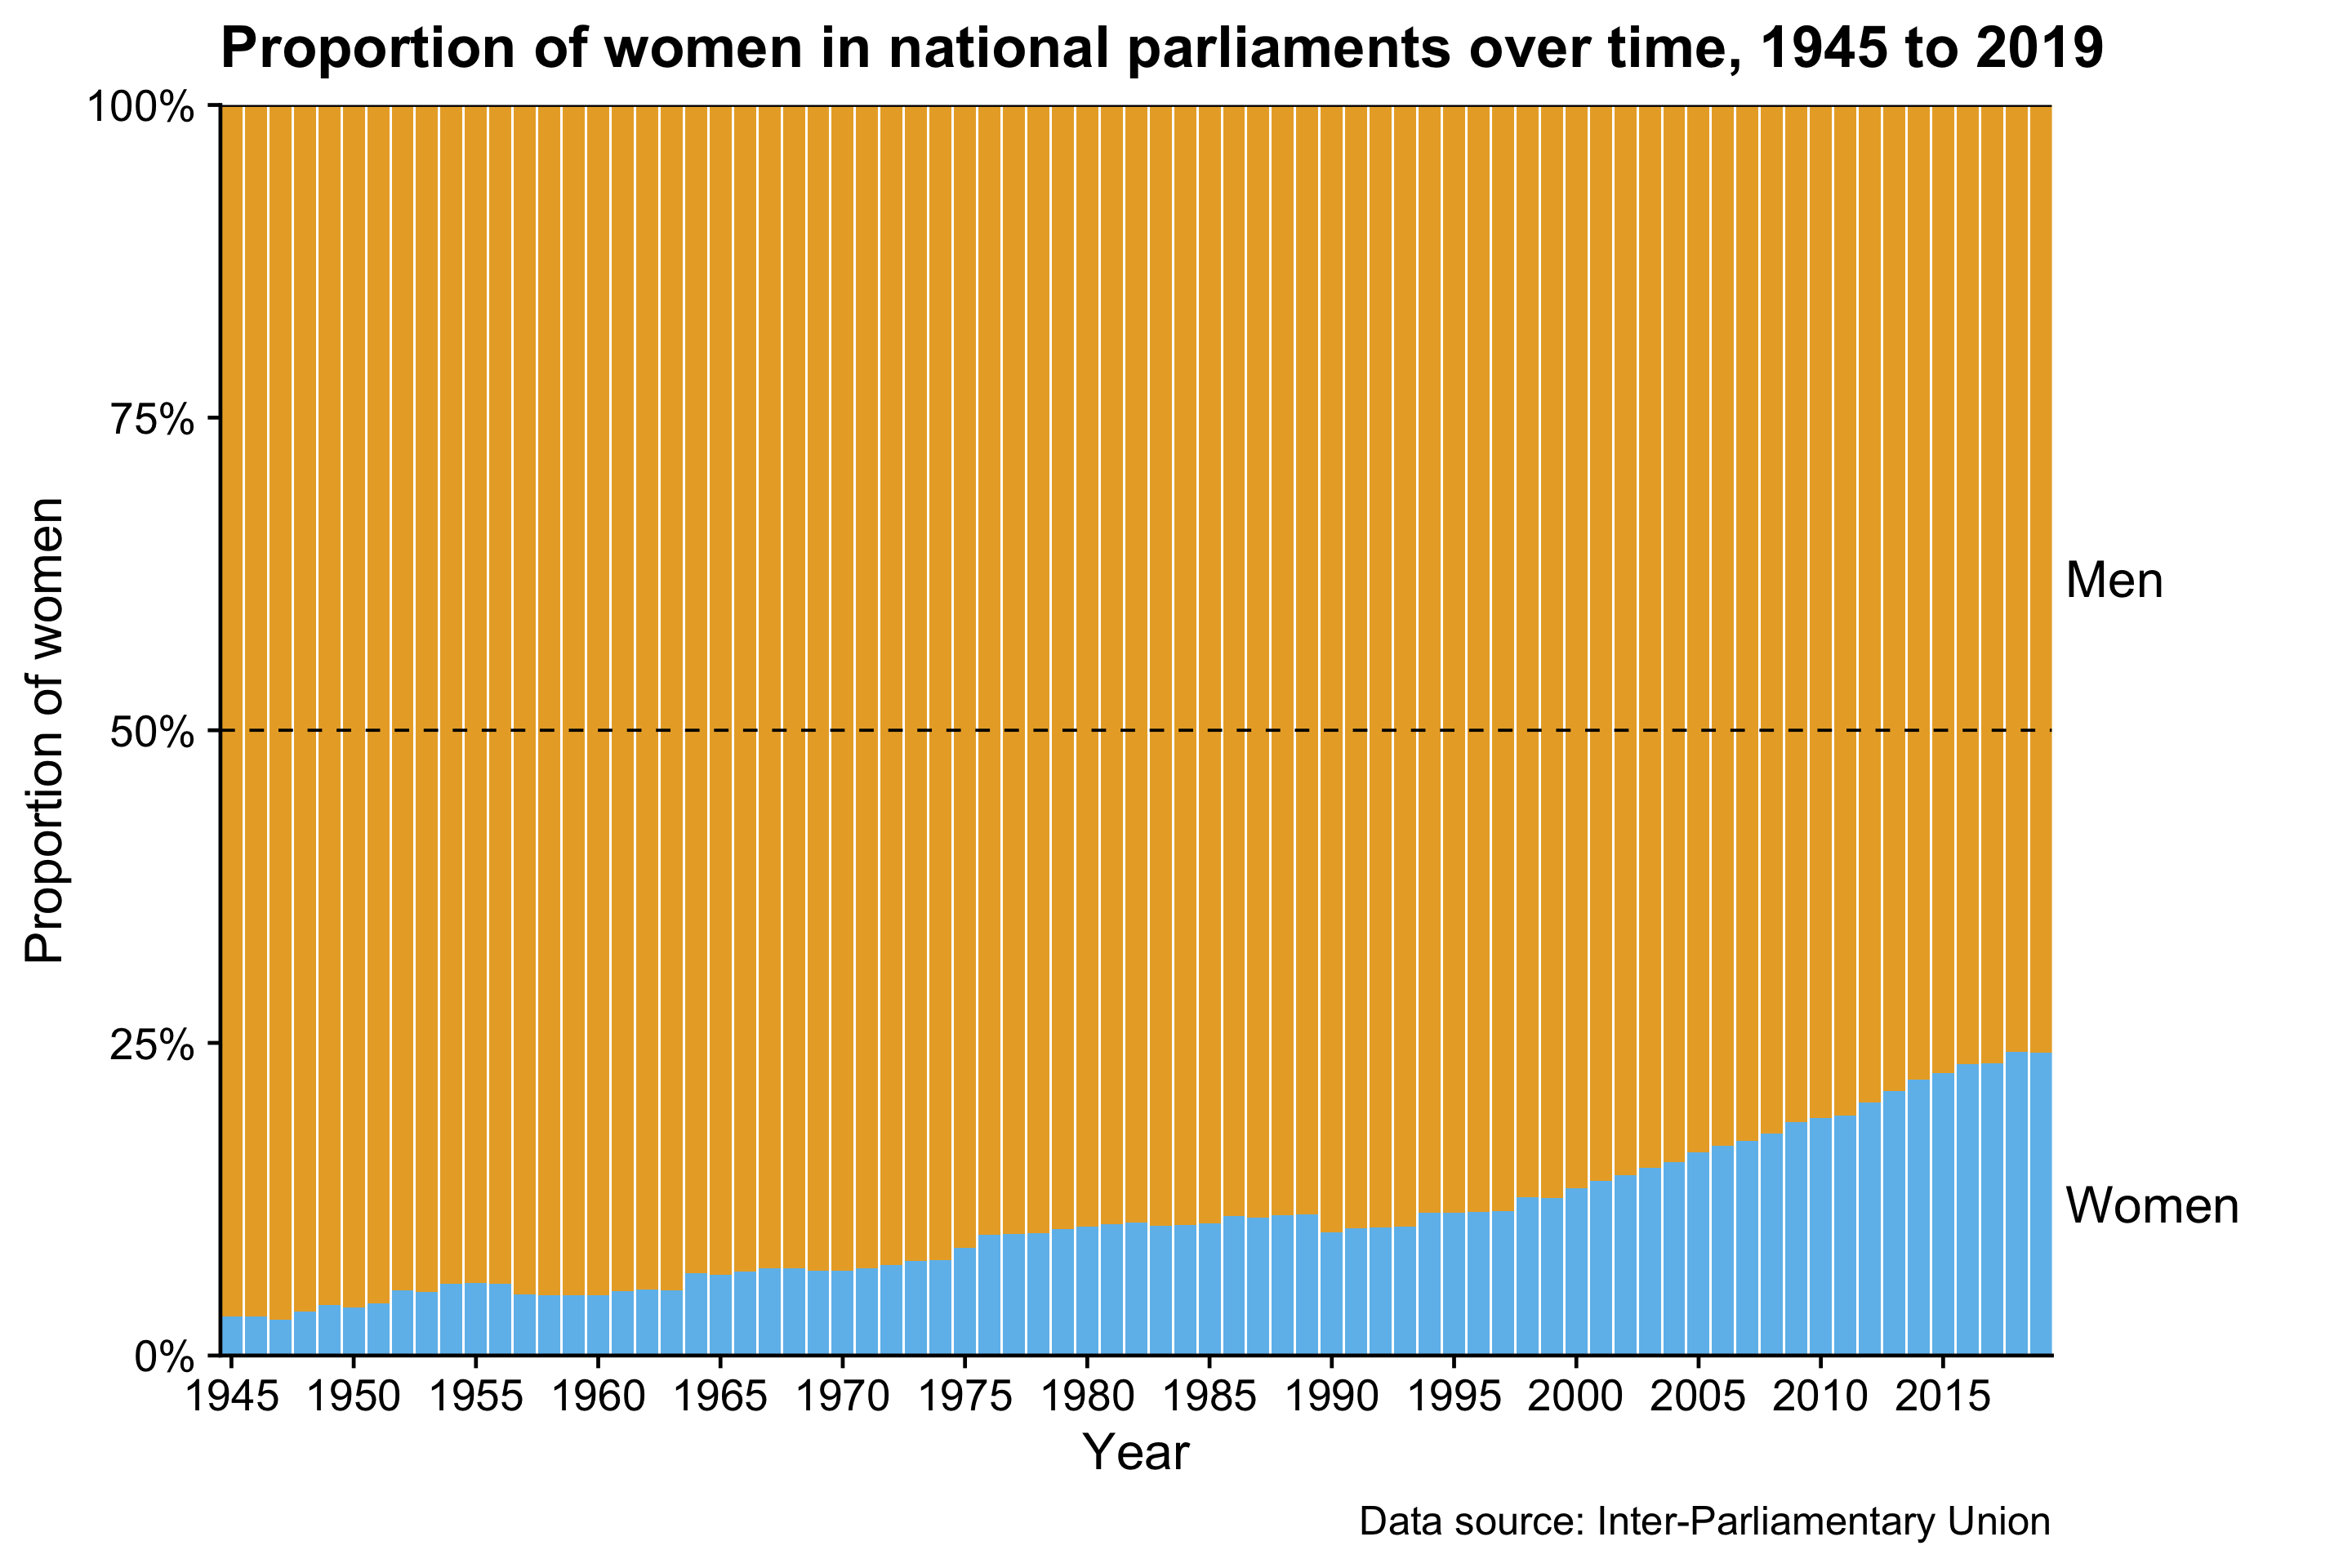
Visualization type: stacked bar chart
Data source: Inter-Parliamentary Union, CSV, 1.7 MB
Technical notes: generated using ggplot2; code
See also: Change in the gender composition of the Rwandan parliament in Fundamentals of Data Visualization by Claus O. Wilke