5. Genome size
This week’s visualization is genome size: how many DNA bases are there in the organisms we know about?
I was surprised quite how many organisms we have this data for. The dataset I used from NCBI has almost 50,000 organisms in it.
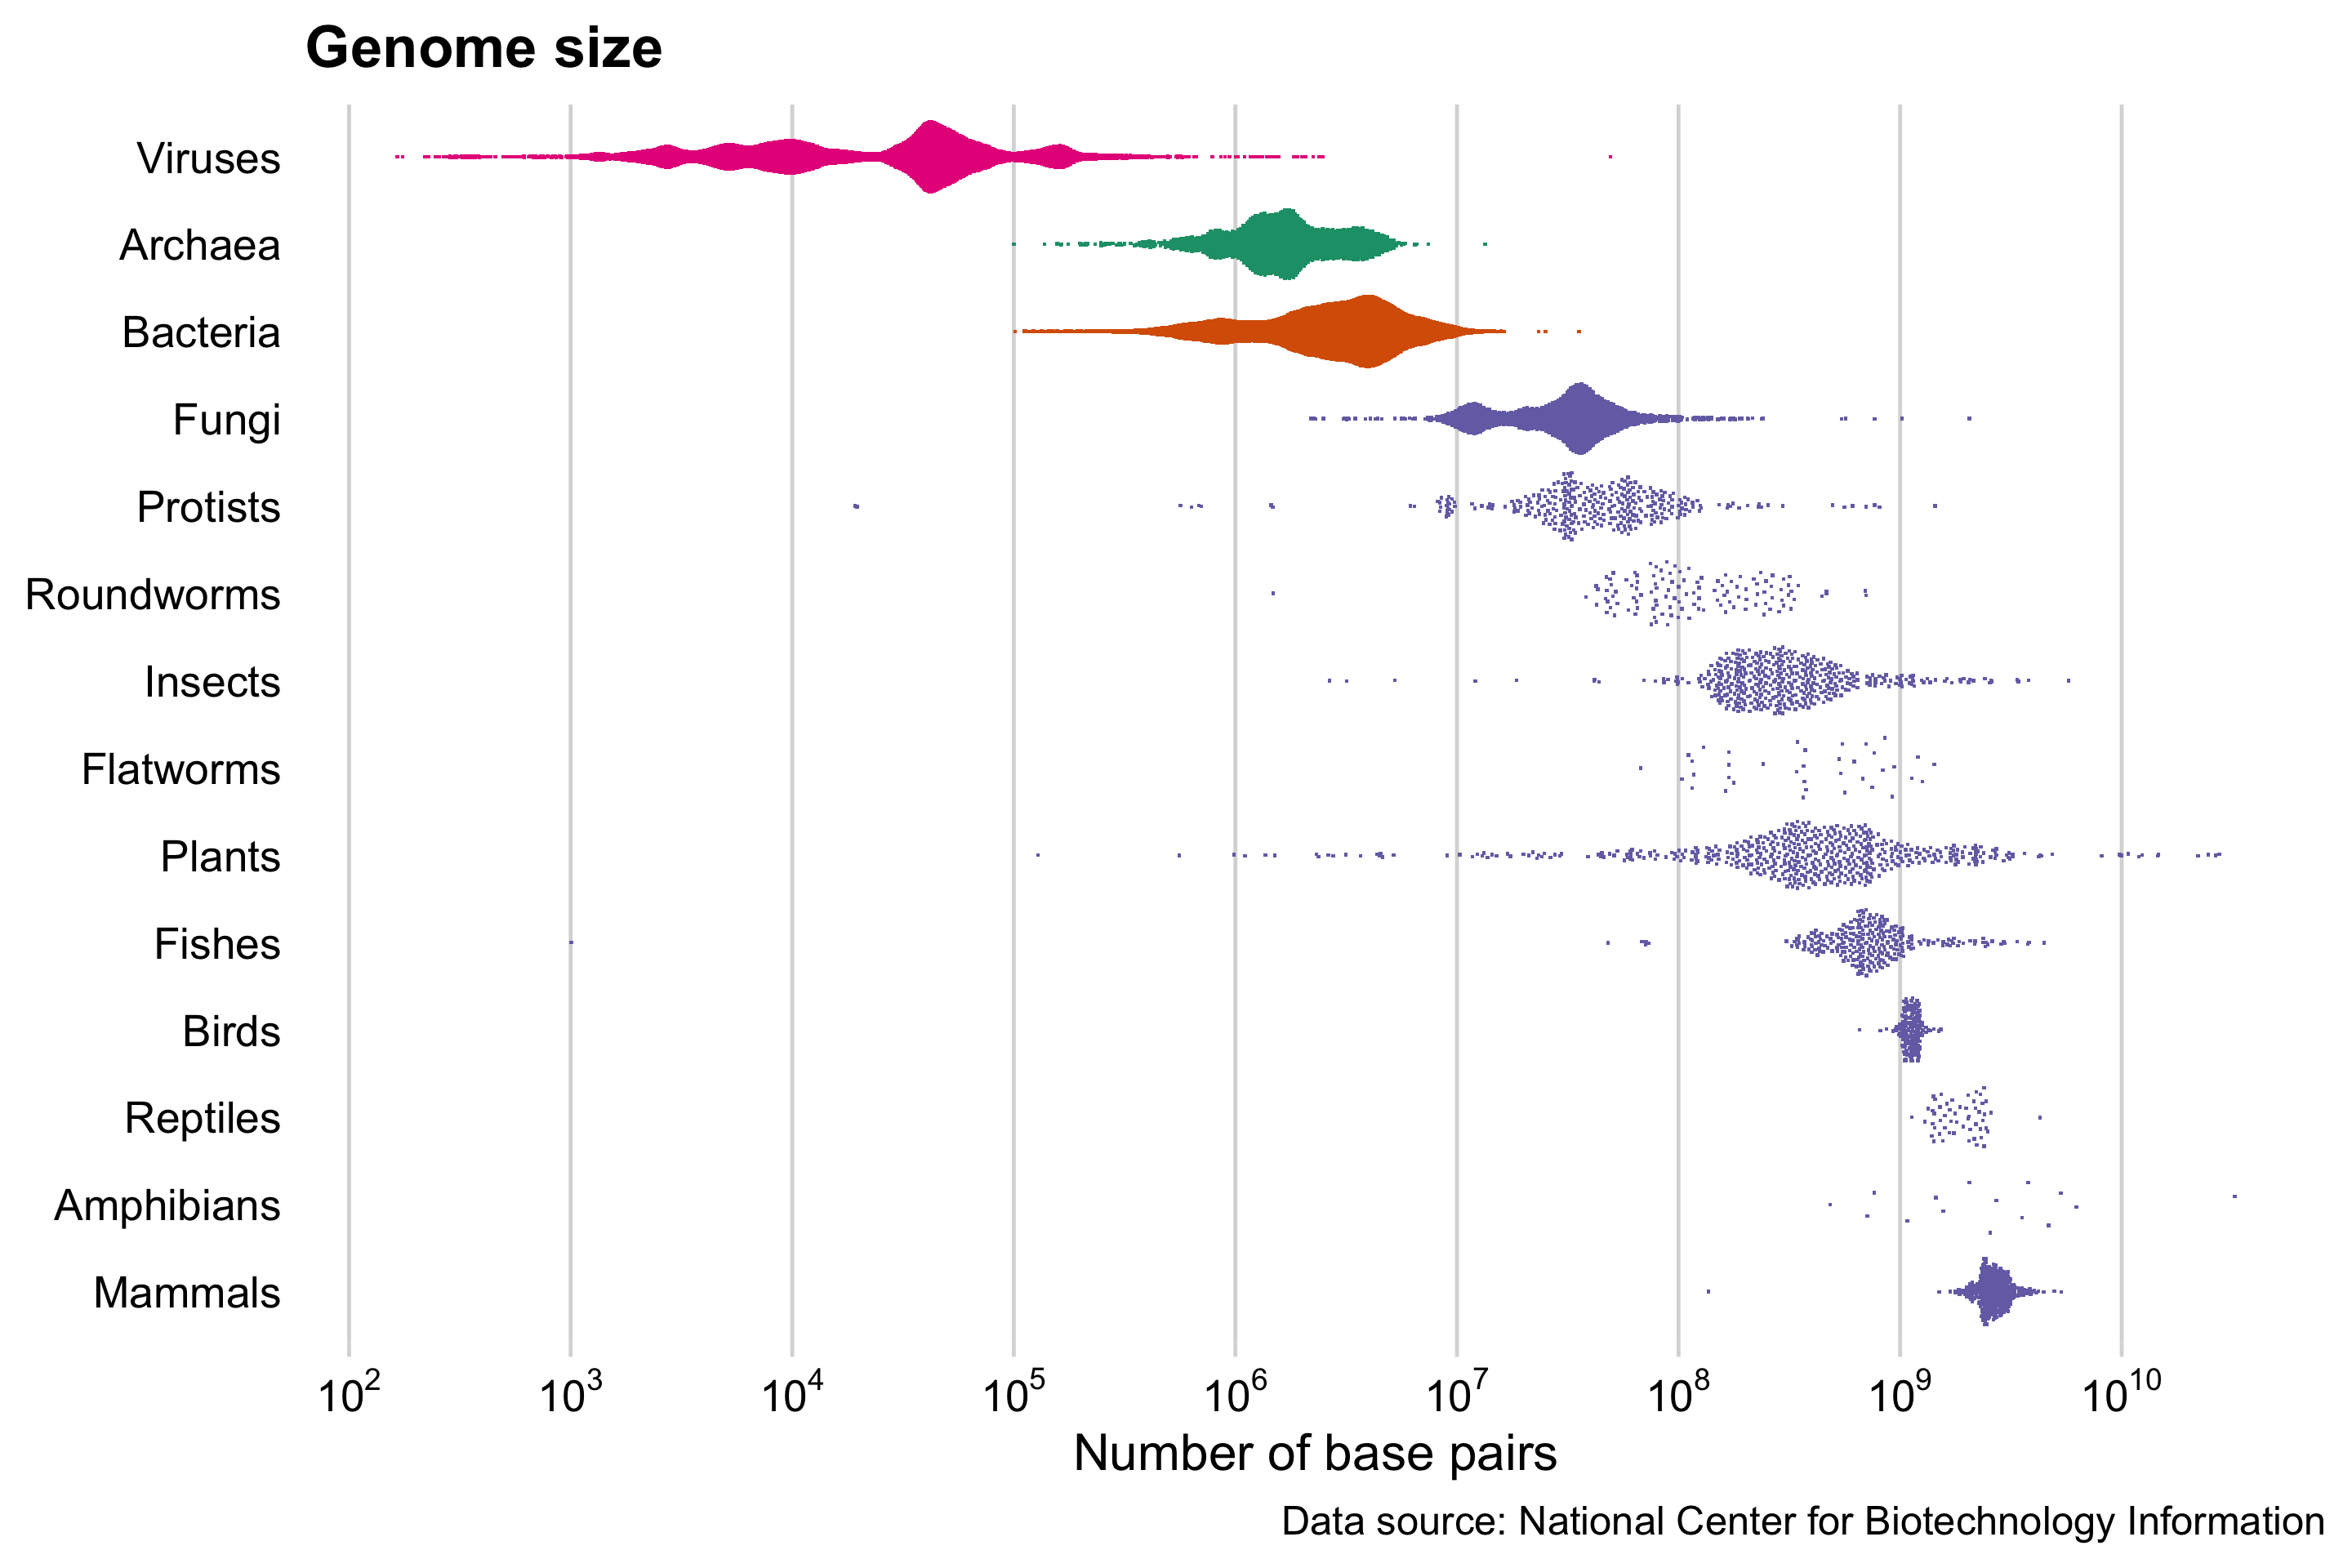
There are four main groups: viruses, archaea, bacteria, and eukaryotes (shown in purple). Eukaryotes are organisms with cells that have a nucleus, and I have broken them down into further subgroups in this chart. All eukaryotes groups on this chart - except fungi, protists, and plants - are animals.
Although genome size has been visualized before, I have not seen an effective demonstration of the distribution of sizes within a group. This visualization uses a beeswarm plot, which shows each data point separately, as well as indicating the distribution (like a violin plot). There is still some overplotting (for viruses and bacteria in particular), but you can still see the distribution of each organism group. The groups are arranged in order of median genome size for the group.
Amazingly, genome sizes span nine orders of magnitude, with viruses and plants having a particularly wide range of sizes.
And what has the largest genome? Ambystoma mexicanum or the axolotl (an amphibian) at a staggering 32 billion base pairs (3.2 x 10¹⁰), which is ten times as many as a human.
Visualization type: beeswarm plot
Data source: Genome Information by Organism from National Center for Biotechnology Information, CSV, 4.1 MB
Technical notes: generated using ggplot2; code
See also: Genome size, Wikipedia; Genome sizes of different organisms, ‘Cell biology by the numbers’ by Milo et al, p287.