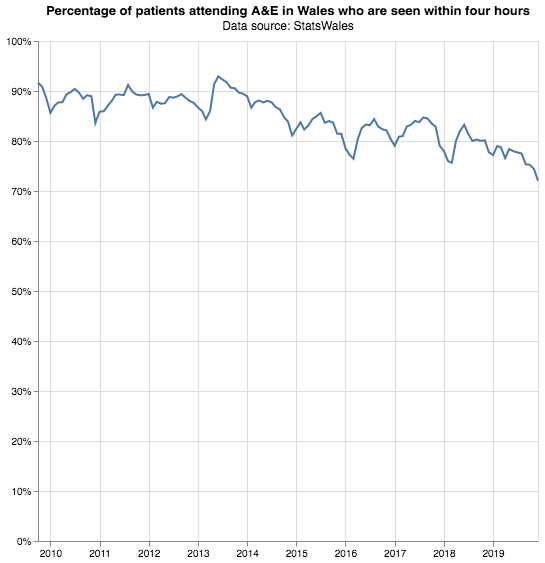
6. A&E waiting times in Wales
The A&E waiting times in England have taken a big dip this winter as the number of people seen within the four-hour target was at it lowest since the measure was introduced in 2004. The Guardian produced a good visualization, which inspired the one here.
Has the same thing happened in Wales? Sadly yes. Over the last ten years the figures have never met the 95% target. And over the last year (2019) the percentage of patients seen within four hours is at its lowest level.
The chart shows a clear seasonal effect: lower performance in the winter with a rebound in the summer (when there is generally less illness). Last year (2019) however there was no discernable rebound, which is worrying since it suggests A&E departments are increasingly under sustained pressure throughout the year.
There’s also an interactive version, and a yearly version where each year is a separate line.
Visualization type: line chart
Data source: StatsWales, CSV, 8.6 MB
Technical notes: generated using Altair, which generates Vega-lite code; code
See also: A&E waiting times in England at their worst on record, The Guardian