15. Body temperature
What’s the normal body temperature for adults? 37°C is the number most commonly cited: for example this NHS guidance says “Normal body temperature is around 37C (98.6F)”.
However, it turns out that there is evidence that adult body temperature has been slowly falling over the last 150 years by around 0.03°C per decade. This is the conclusion of a remarkable paper entitled “Decreasing human body temperature in the United States since the Industrial Revolution”, by Protsiv et al that was published in January this year.
This means that 36.6°C (97.9°F) is the more representative number for normal body temperature today.
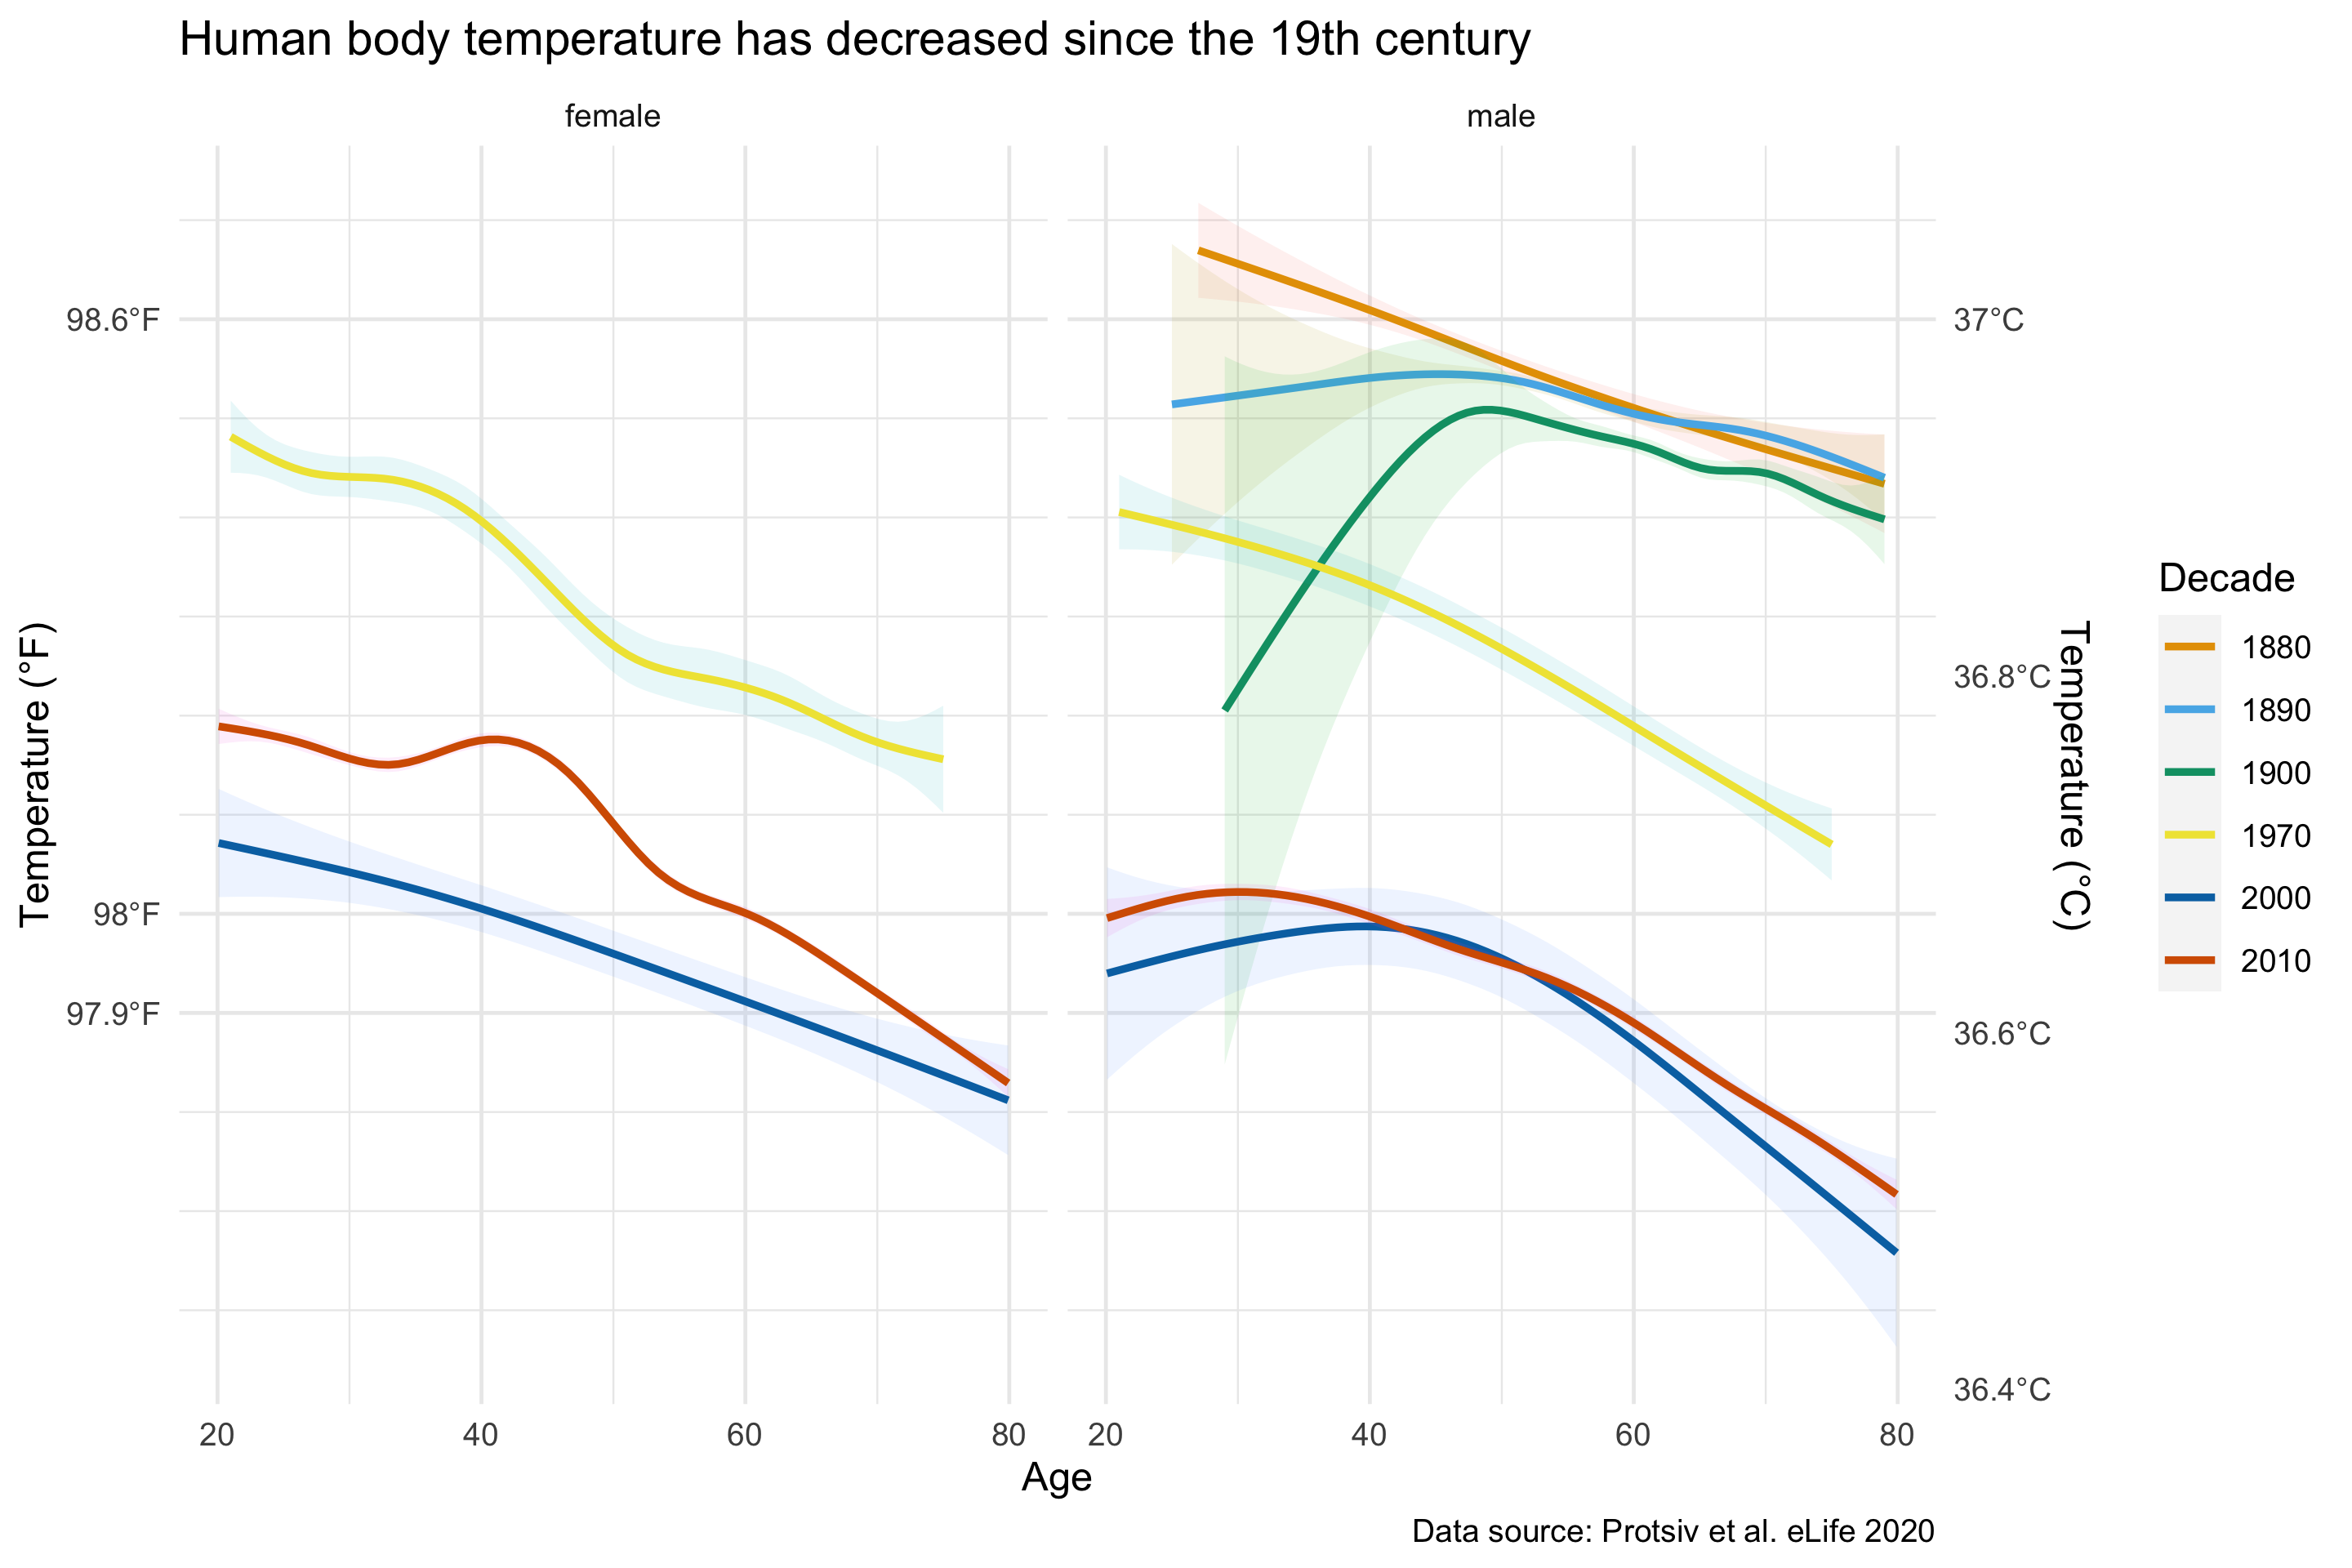
In my visualization of the data I have plotted average body temperature against age, segmented by men and women. I’ve also plotted the measurements from each decade on separate lines. (The chart doesn’t show that there were three separate studies, one for the 1880s/1890s/1900s, a second for the 1970s, and a third for 2000s/2010s; the paper has more details.)
The first thing to notice is that body temperature drops as we get older. Also, women tend to have slightly higher temperatures than men.
But the most surprising takeaway is that average body temperature has dropped since the 19th century. The paper suggests that this is because of reduced levels of inflamation in the population. Measurement bias was ruled out by observing that there was a statistically significant drop between decades in the first study where the measurement technique (such as the type of thermometer) didn’t change.
However, the chart suggests that body temperature may no longer be decreasing, as the 2010s shows higher temperatures than the 2000s. (This was not something that was examined in the paper.)
So the conclusion is that 36.6°C (97.9°F) is a better “normal” temperature. This is the same result that another recent study found by examining the temperature measurements of 35,488 patients (Obermeyer et al., 2017).
Visualization type: line chart
Data source: “Decreasing human body temperature in the United States since the Industrial Revolution”, Protsiv et al. eLife 2020, combined data from three previous studies, CSV, 125 MB
Technical notes: generated using ggplot2; code
See also: Figures from Protsiv et al. eLife 2020