29. Poisonous mushrooms
High-dimensional datasets are notoriously difficult to visualize. As Geoff Hinton put it
To deal with a 14-dimensional space, visualize a 3-D space and say ‘fourteen’ to yourself very loudly. Everyone does it.
The Mushroom Data Set from the Audobon Society Field Guide, and donated by Jeff Schlimmer, is a 22-dimensional dataset of physical characteristics of mushrooms. The characteristics are all categorical (not numeric) and include things like cap shape (bell, conical, convex, flat, knobbled, or sunken), and habitat (grasses, leaves, meadows, paths, urban, waste, or woods).
The dataset includes “23 species of gilled mushrooms in the Agaricus and Lepiota Family”, and it contains over 8000 rows (each row is an individual mushroom observation). In addition to the 22 physical characteristics, each mushroom is labelled as being edible (‘e’) or poisonous (‘p’), in the first column.
The first five rows look like this:
p,x,s,n,t,p,f,c,n,k,e,e,s,s,w,w,p,w,o,p,k,s,u
e,x,s,y,t,a,f,c,b,k,e,c,s,s,w,w,p,w,o,p,n,n,g
e,b,s,w,t,l,f,c,b,n,e,c,s,s,w,w,p,w,o,p,n,n,m
p,x,y,w,t,p,f,c,n,n,e,e,s,s,w,w,p,w,o,p,k,s,u
e,x,s,g,f,n,f,w,b,k,t,e,s,s,w,w,p,w,o,e,n,a,g
How can we hope to visualize this dataset?
The trick is to compress the 22 dimensions into two and display them as a 2D scatterplot. This works since there are correlations between the different dimensions, so we don’t “need” the full 22 dimensions to represent the data. However, quite how you go about reducing the number of dimensions is a difficult challenge.
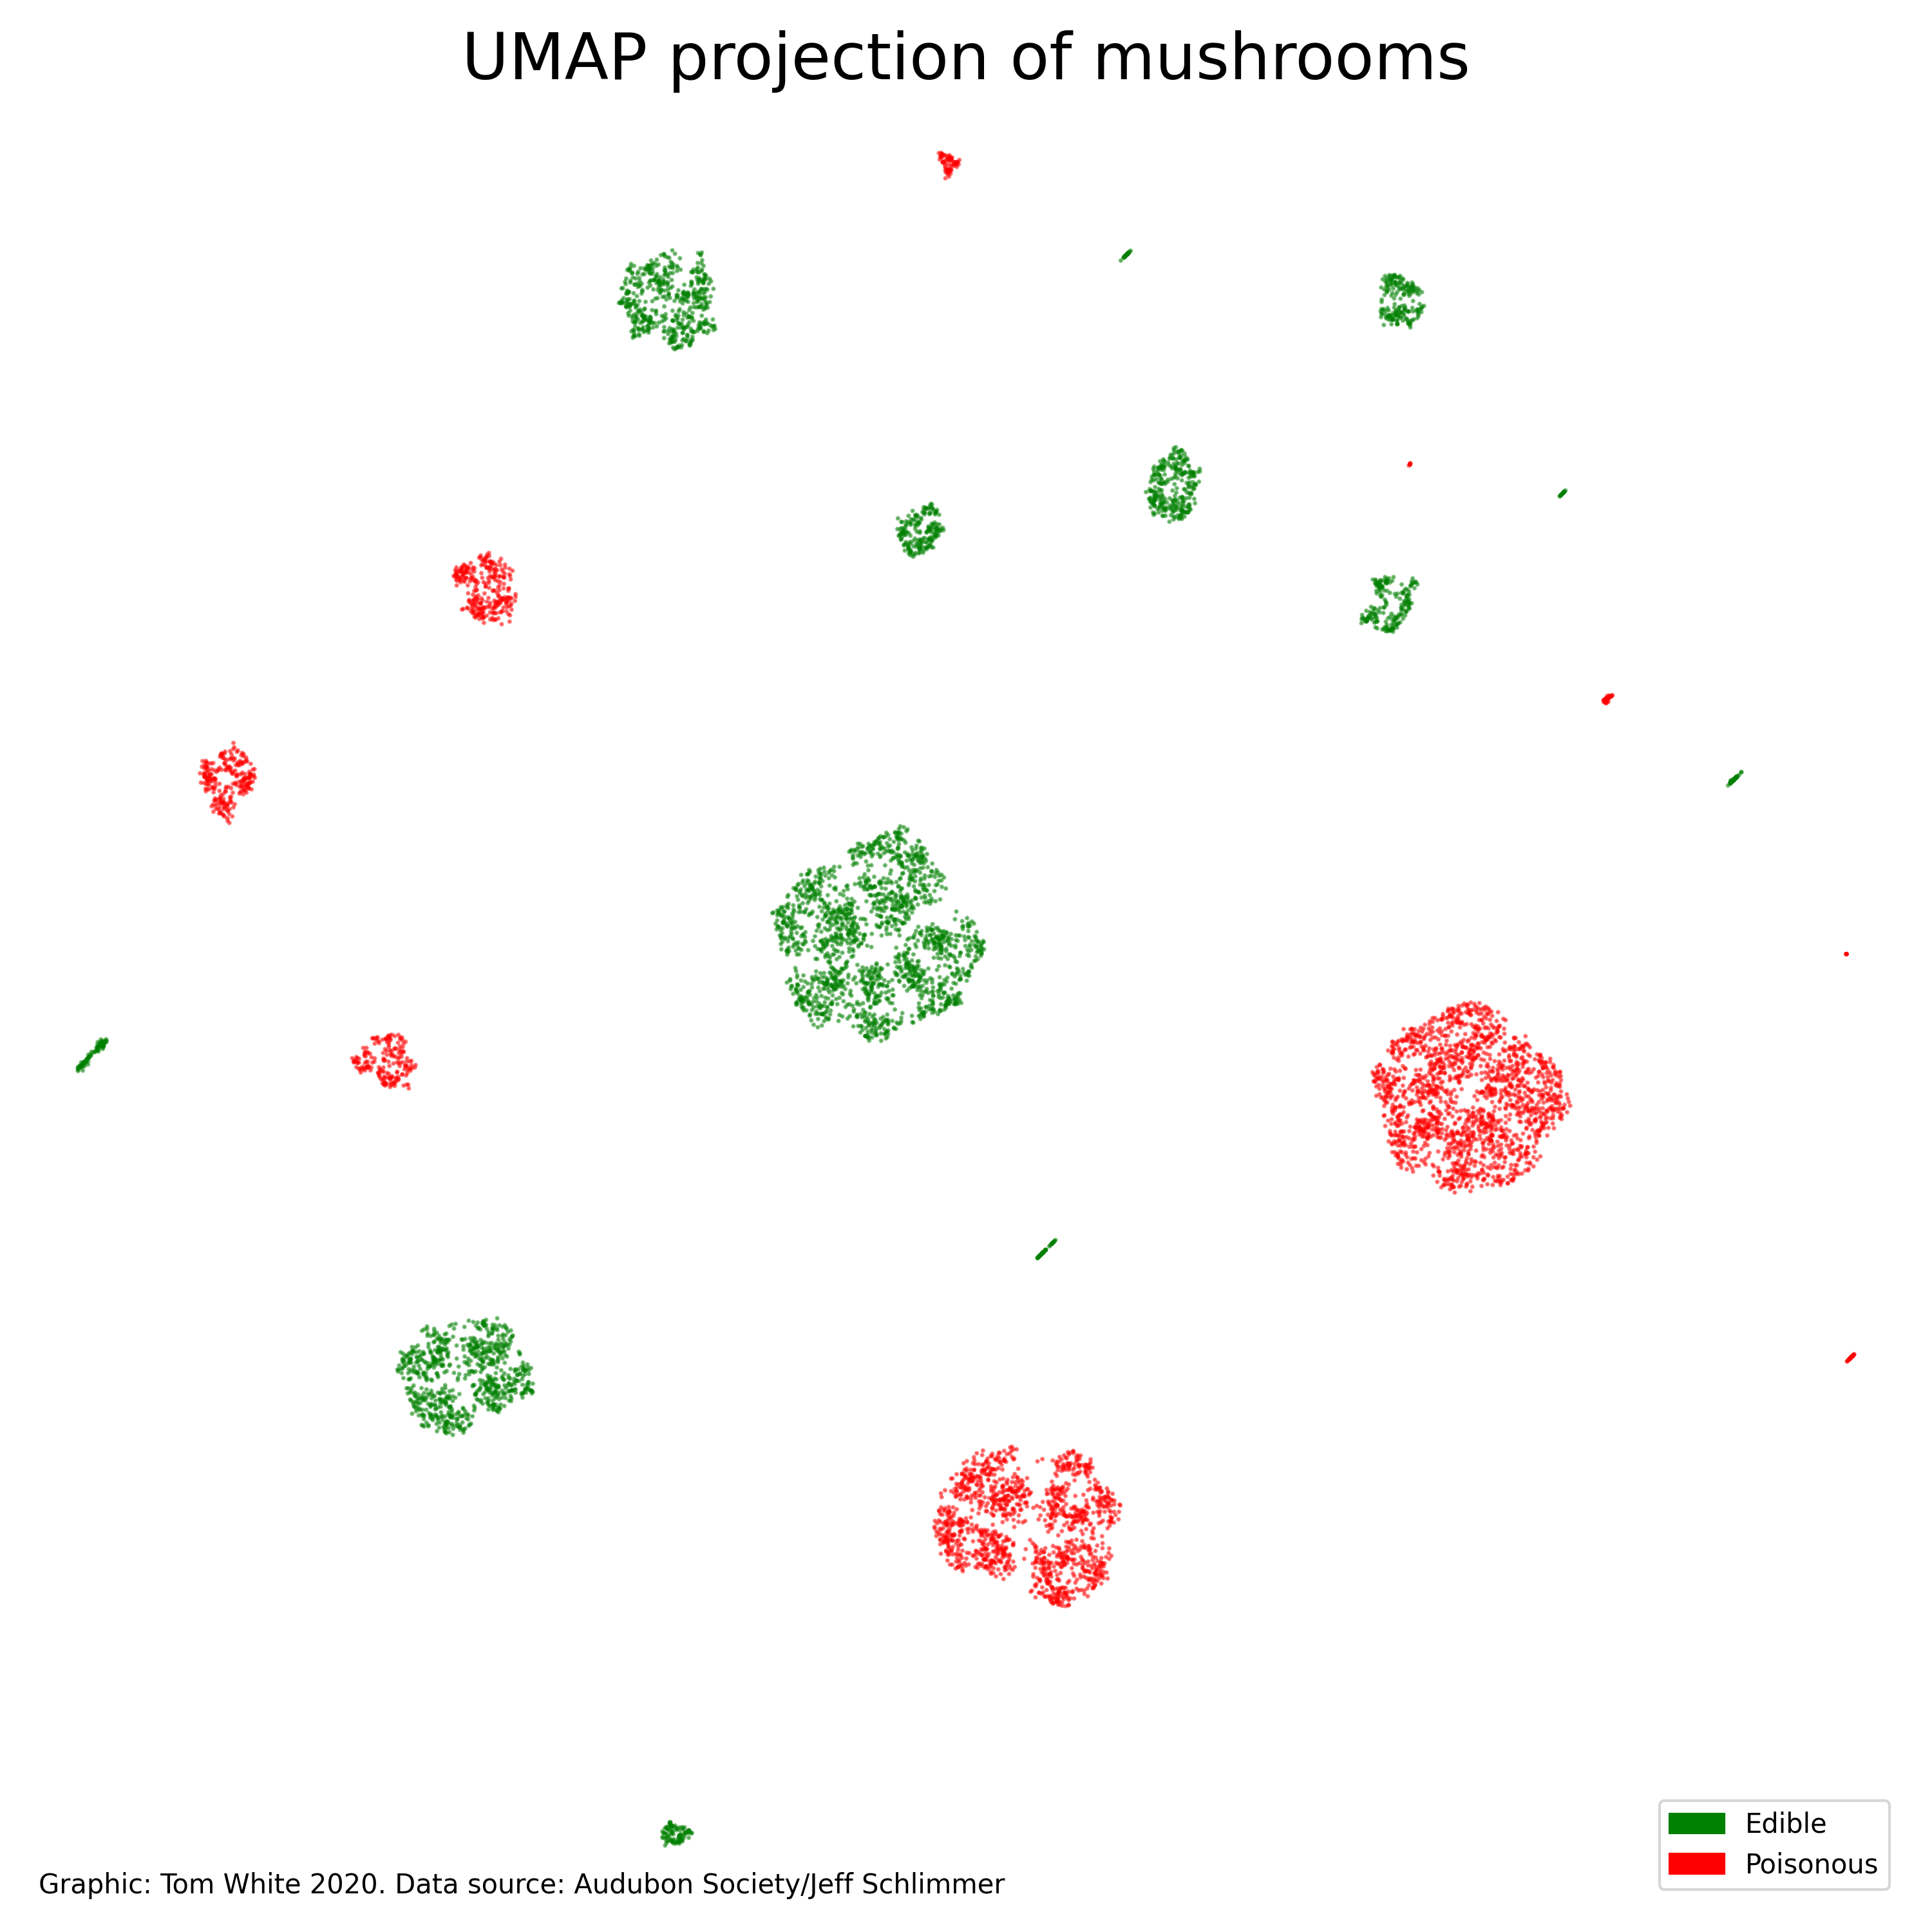
Thankfully there has been a lot of research into the problem of dimensionality reduction over the years. I’m using a technique called UMAP that is fast and has some desirable properties like being good at preserving local and global structure.
What jumps out of the plot is the clusters. If you count them you will find 23, one for each of the 23 mushroom species. The input I gave to UMAP did not include the edible/poisonous label - I coloured the points separately afterwards - so UMAP was able to find the distinct species just by using the physical characteristics (cap shape, habitat, etc). This is quite an achievement.
If you are interested in learning more about using UMAP for exploring multi-dimensional datasets, I strongly recommend this PyData LA 2019 talk, “Embed All the Things” by John Healy (repo here).
Visualization type: UMAP scatterplot
Data source: Mushroom Data Set from the Audobon Society Field Guide, and donated by Jeff Schlimmer, CSV, 365 KB
Technical notes: generated using UMAP (with the Jaccard metric) and matplotlib; code (also includes a D3 version using umap-js)
See also: “Embed All the Things” by John Healy