36. Disk drive capacities
Backblaze is a company that offers cloud backups, and every quarter it publishes data on the disk drives it uses in its data centre. The data is very detailed: every day a snapshot of each active disk drive is taken to record statistics about its operation.
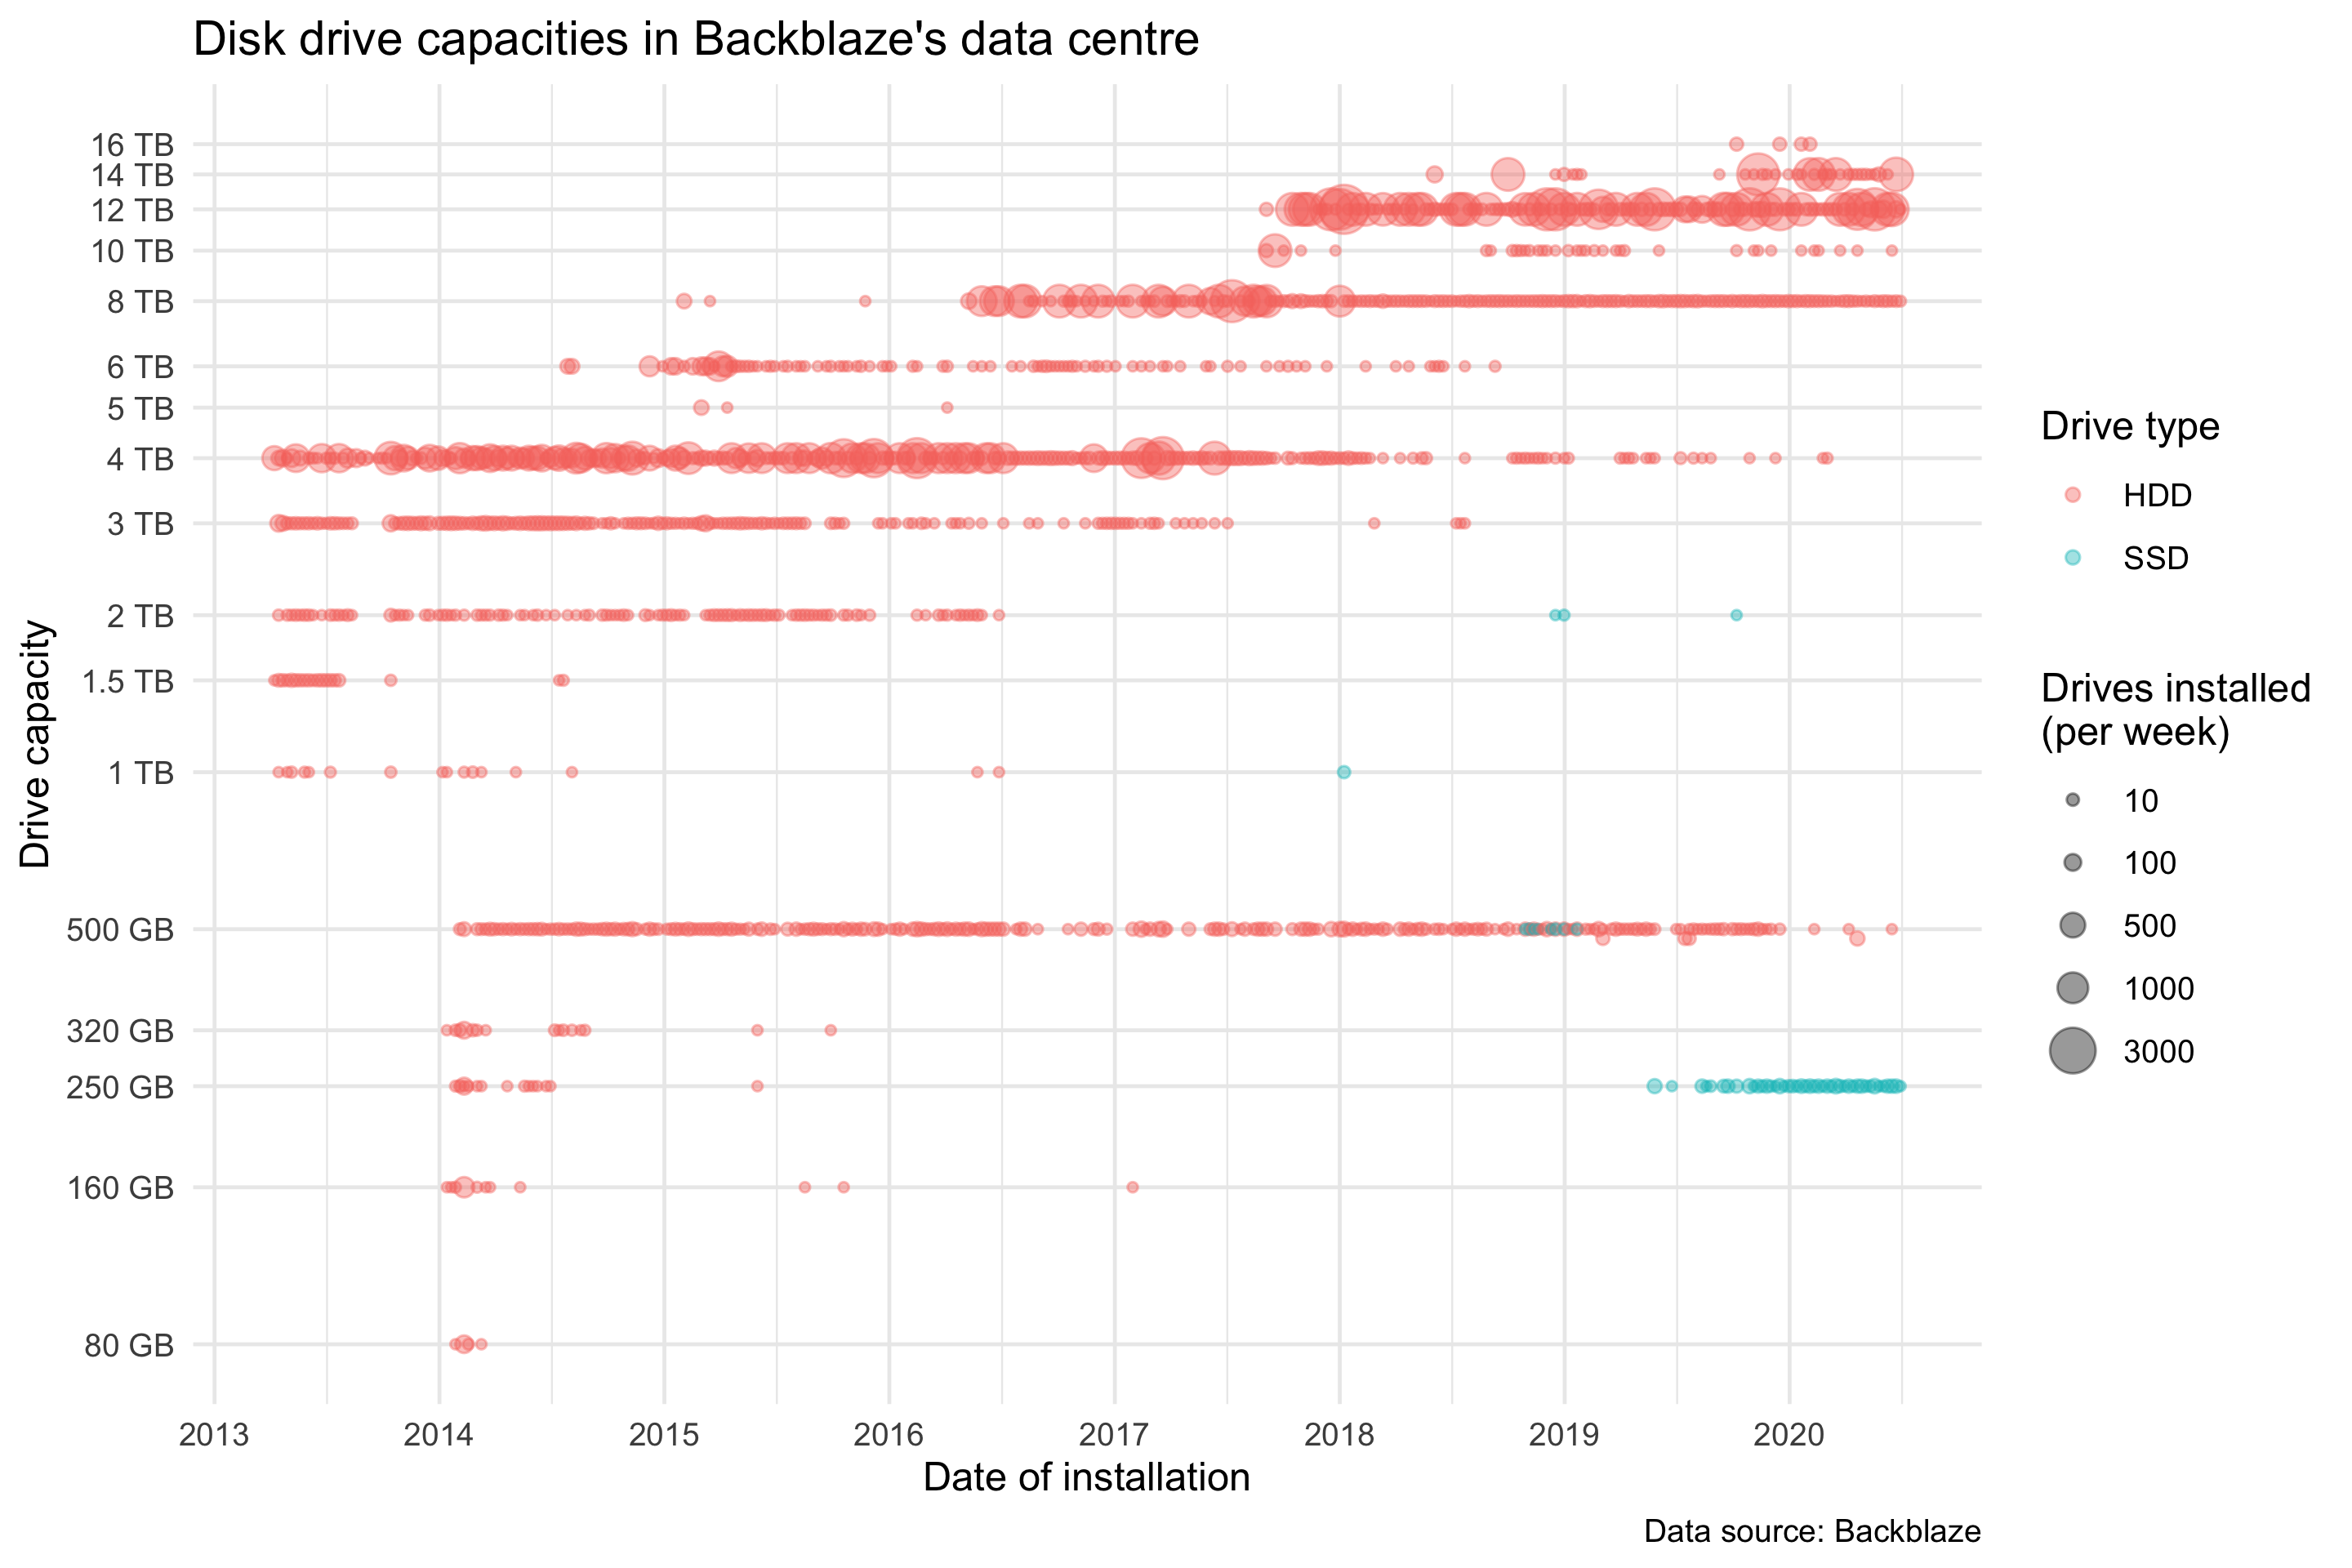
I processed the data to find the capacity of every drive that was installed over the lifetime of the dataset (2013-present):
While this is specific to Backblaze’s business, a few interesting themes stand out.
Most obviously, hard disk capacity has increased over time. In 2013, 4 TB drives were the norm, but that changed in 2016 to 8 TB drives, and in 2018 to 12 TB drives. (These dates don’t necessarily reflect the industry as a whole, it’s just when Backblaze chose to install these sizes of drive.)
From the second half of 2019, solid-state drives (SSDs) were being installed in significant numbers, although not anywhere near the rate of hard disk drives (HDDs). Presumably, the lower latency of SSDs is important for some part of Backblaze’s business, despite their higher cost and much smaller capacity (0.25 TB vs 12 TB).
The chart shows that in 2013 there were no drives with less than 1 TB capacity, even though from 2014 onwards many sub-1 TB drives were still being installed. I don’t know why this is, but perhaps they didn’t gather the data for 2013, or maybe there was some kind of operational or policy change.
Visualization type: bubble plot
Data source: Backblaze, CSV, 53 GB