37. Tooth cavities
Another suggestion from Lottie - show how the number of tooth cavities varies by tooth:
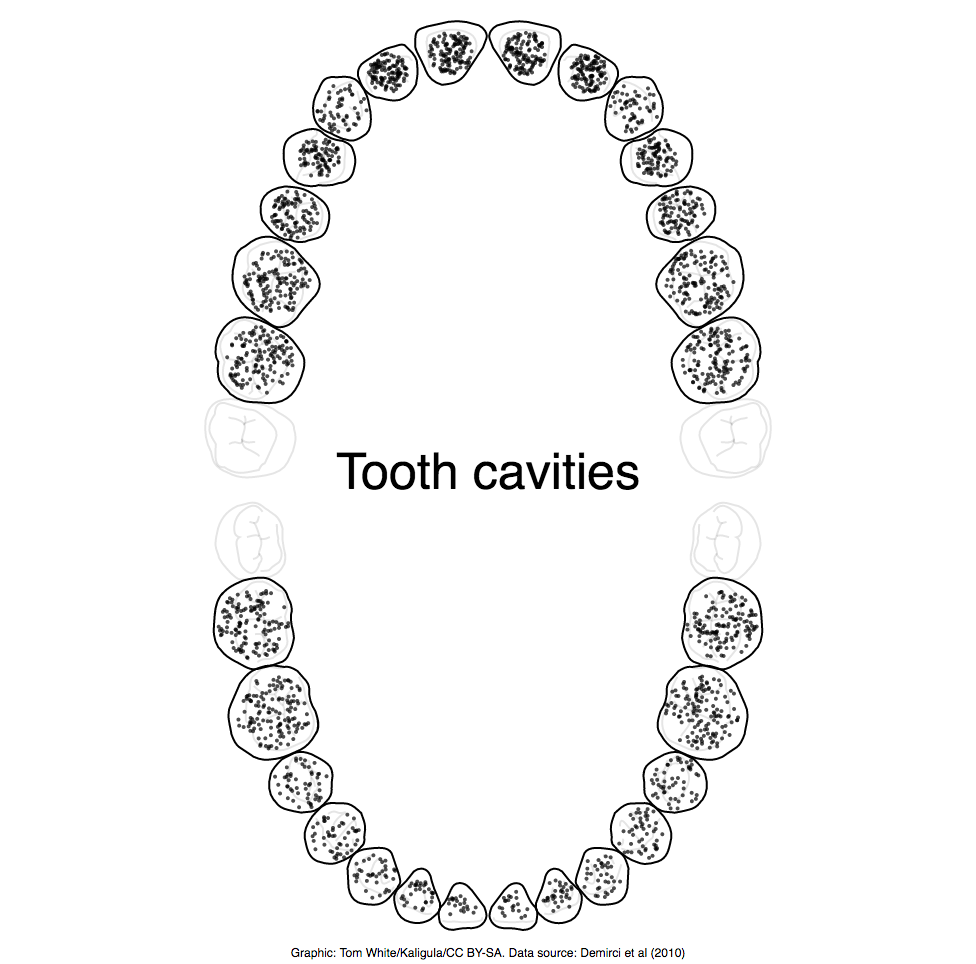
The interactive version shows the stats for each tooth.
Each dot is a cavity (also know as a carie), and the data is from Table 1 in Prevalence of Caries on Individual Tooth Surfaces and its Distribution by Age and Gender in University Clinic Patients by Mustafa Demirci, Safa Tuncer, and Ahmet Ayhan Yuceokurb (2010).
The graphic makes it clear that there are more cavities on the upper jaw than the lower one. This makes sense as it’s easier to brush teeth in the lower jaw. Teeth at the back have a higher number of cavities, but this is offset by their relative size.
The tooth image is from Wikipedia commons (Kaligula / CC BY-SA).
Visualization type: dot plot, isotype chart, pictogram
Data source: Prevalence of Caries on Individual Tooth Surfaces and its Distribution by Age and Gender in University Clinic Patients, CSV, 255 B