38. Family lines
Eliane does family history research, and has traced some lines of her family back to the 1600s. I wanted to make a visualization that allowed you to see direct ancestors, in a way that was different to a traditional family tree. This is what I came up with.
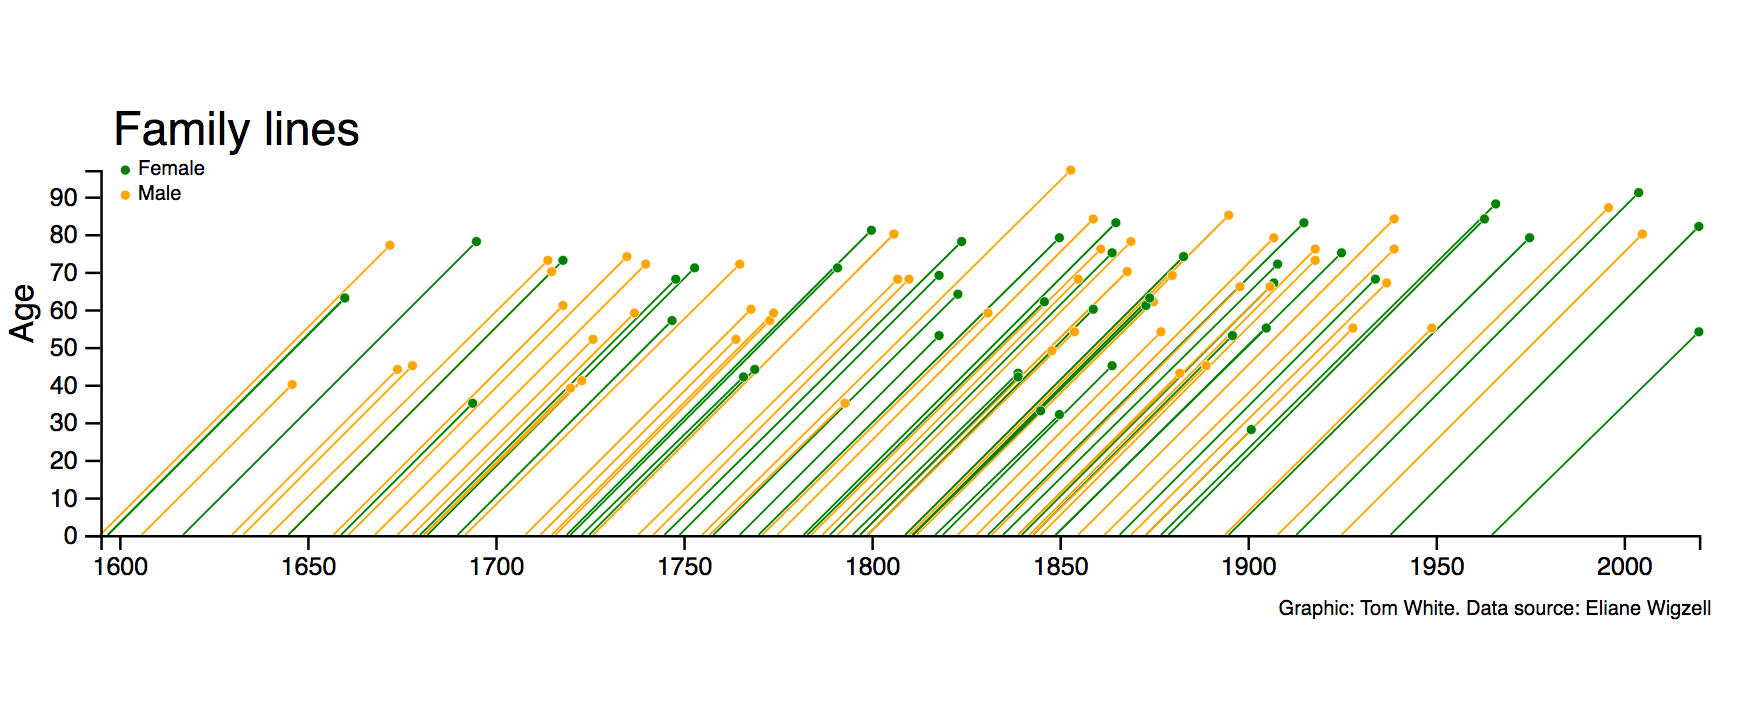
Each person is represented as a line from their birth to their death (or to the current time if they are still alive). This way of viewing the data means you can see when people are close contemporaries of one another, and also their relative ages at any point in time.
On the interactive version you can hover on the circles to get information about that person, and also to see their direct ancestors (other lines are dimmed).
One thing this visualization highlights is the early death of some mothers due to childbirth. For example, Lizzie Sarah Blandon died in 1901 at the tragically young age of 28.
I also produced an equivalent for my family tree.
Visualization type: line chart
Data source: GEDCOM file from Ancestry.com, GEDCOM, 15 MB