44. UK tree planting
The number of trees planted per year in the UK has declined over the last 50 years.
This visualization shows the percentage area of each country that has been used for tree planting each year, over that period:
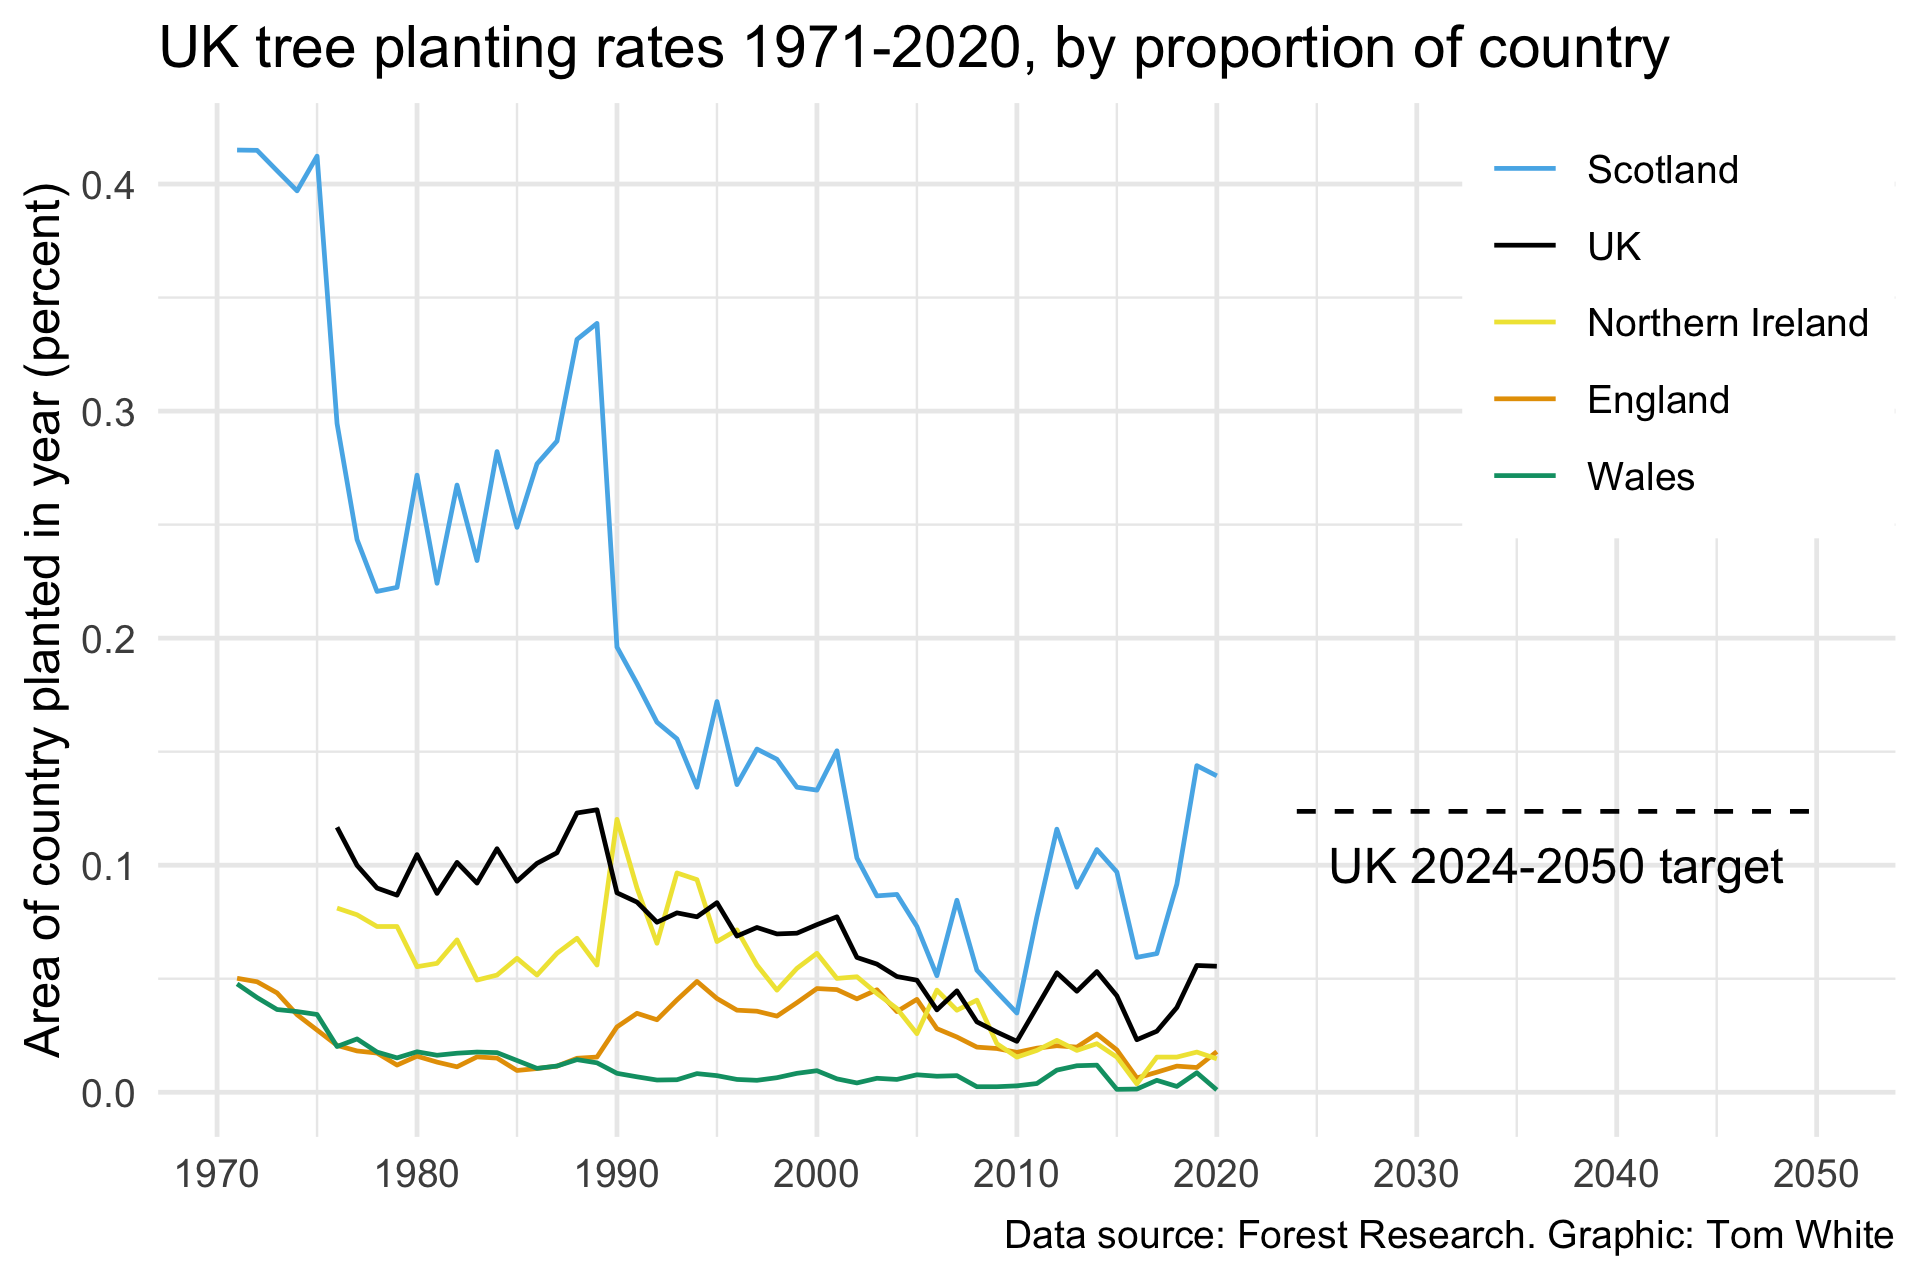
Scotland has had the largest planting rate, and Wales the smallest.
I was surprised that Wales has had and continues to have such a low rate, given that it has so much space for tree planting. This is all the more reason to support organizations like Stump Up For Trees, which is aiming to plant a million trees in the Brecon Beacons. (You can donate here.)
The dashed line shows the target rate recommended by the Committee on Climate Change to meet the net-zero target. This rate translates to planting trees on approximately 1/8 of a percent of the area of the UK every year by 2024 until 2050. This is more than double the rate of planting in the year up to 31 March 2020, and is not at a level seen since 1989.
What are the rates in terms of land area and numbers of trees? The next chart shows the same data, but the y-axis measures millions of trees (on the left), and thousands of hectares (on the right). The 2024 target is 30 thousand hectares.
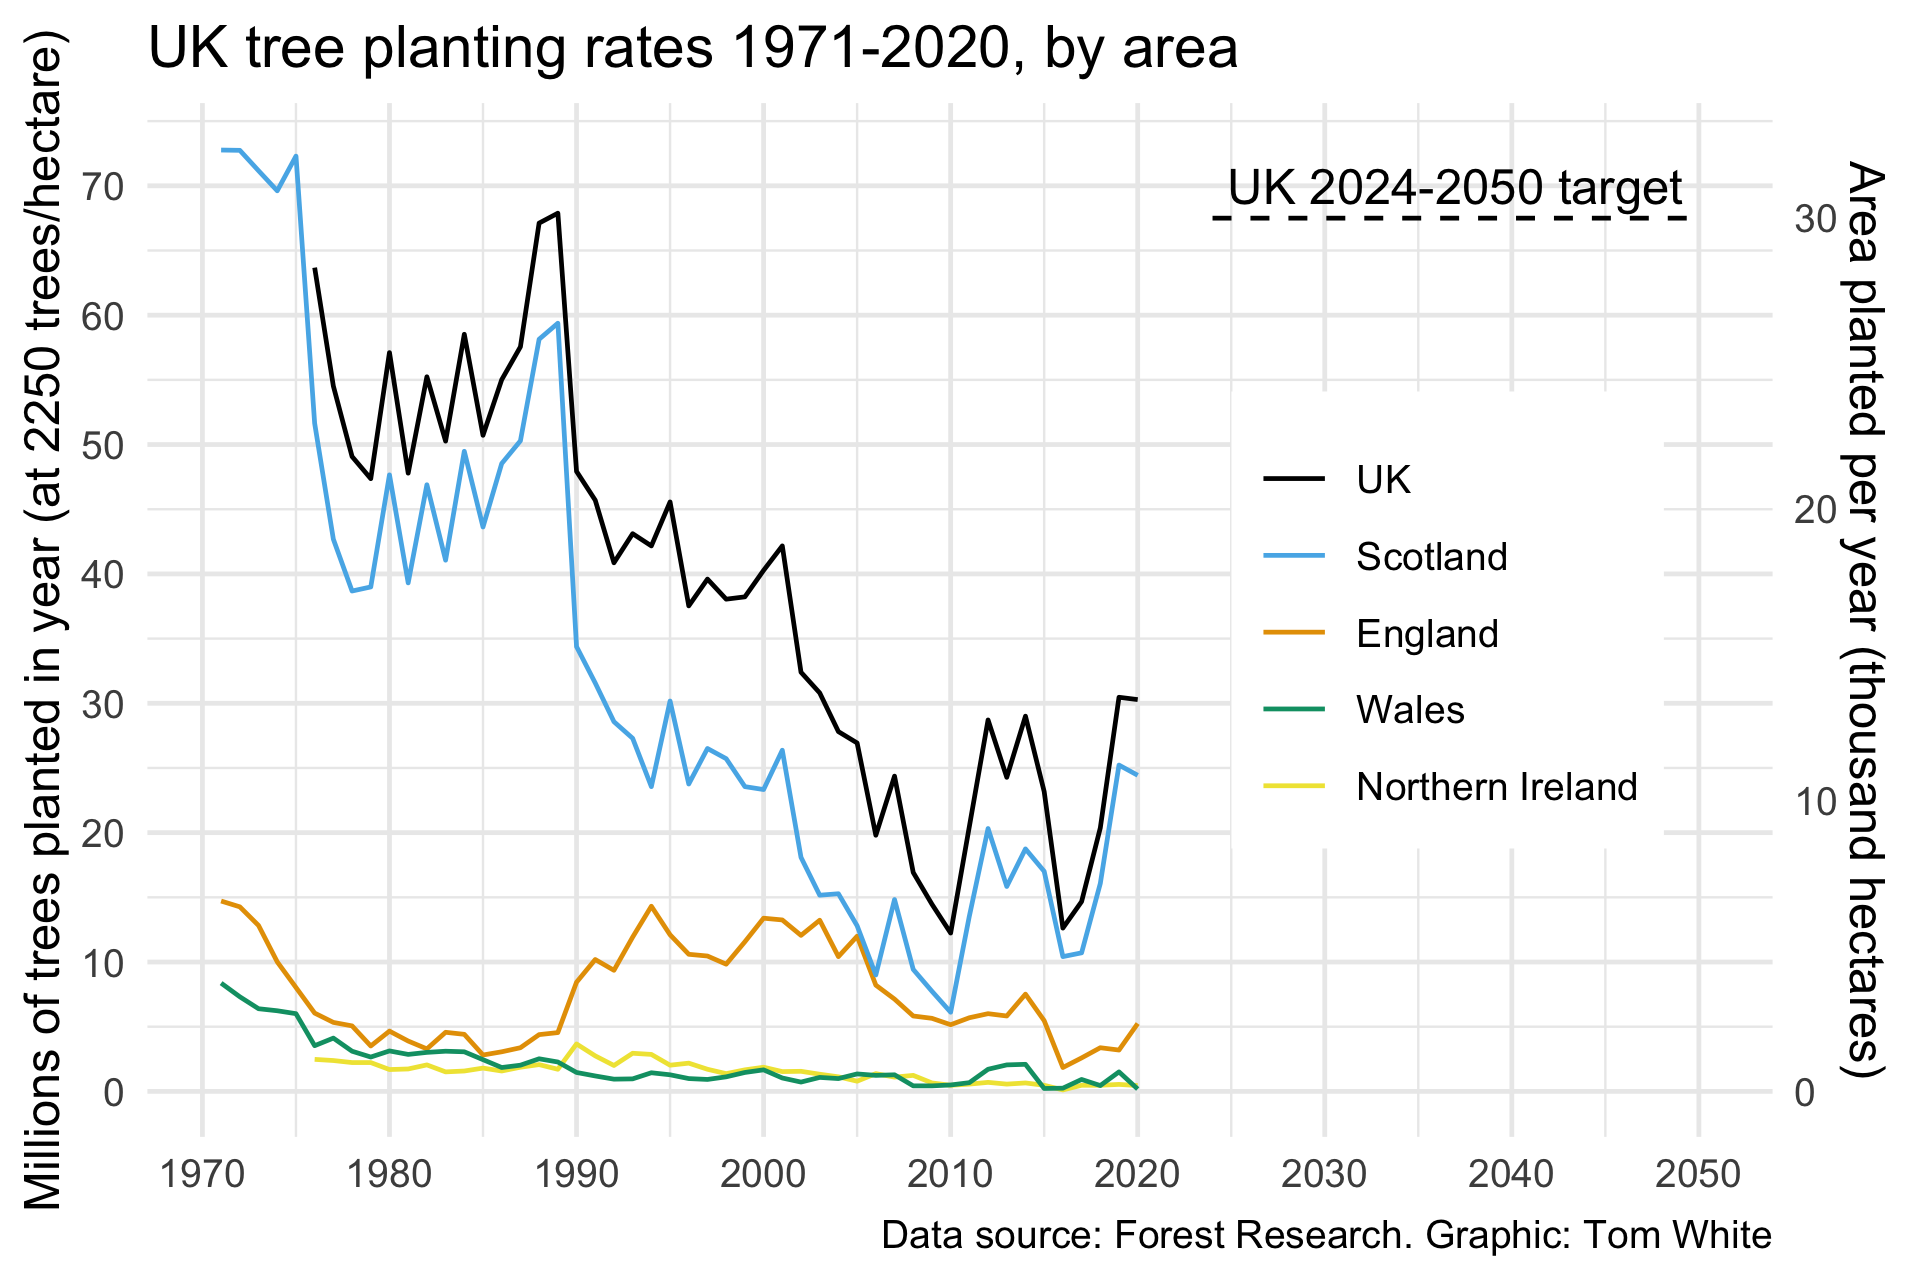
I assumed a planting density of 2250 trees per hectare (from Cumbria Woodlands), which corresponds to 2 metre spacing between trees. The actual numbers planted are almost certainly different, but it gives a rough idea of what we are aiming for: about 70 million trees a year.
Visualization type: line chart
Data source: Forest Research, XLSX, 98 KB.
Technical notes: generated using ggplot2; code
See also: 2. One million trees in Brecon Beacons National Park; Budget 2020: Woodland expansion by CarbonBrief