48. Wars
This week’s visualization is of violent conflicts from 1400 to 2000.
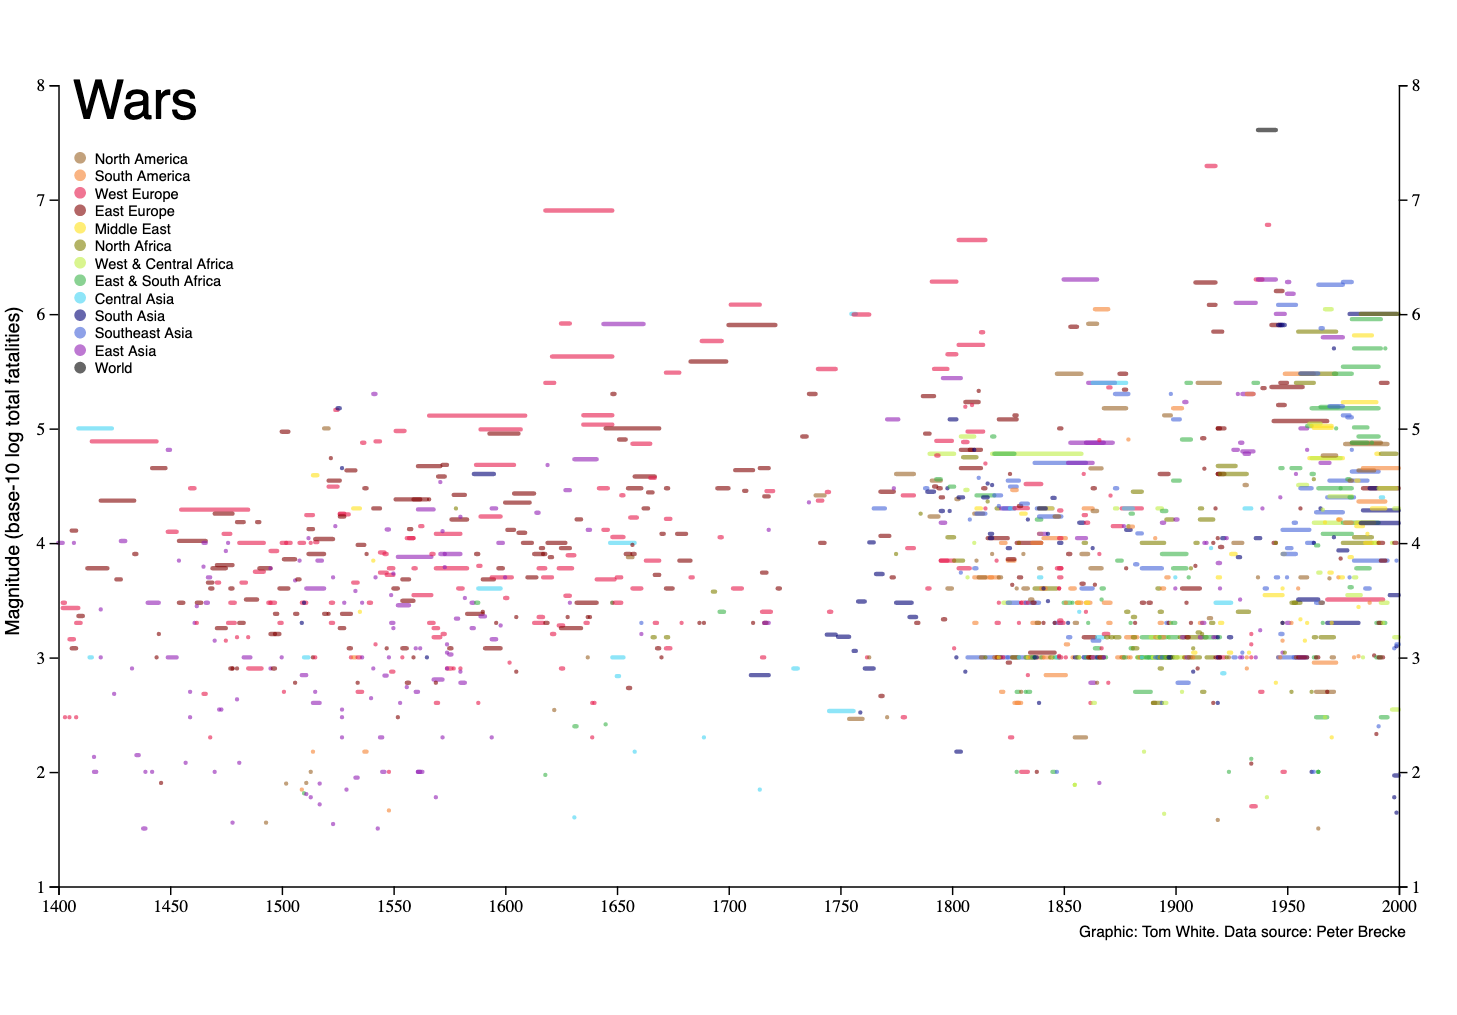
Each line is a conflict, with the length representing the duration of the conflict. The y-axis measures the magnitude of the conflict, defined as the base-10 logarithm of the total number of deaths. So for example, a war with a million deaths would be counted as magnitude 6.
Using magnitudes like this follows Lewis Fry Richardson’s statistical treatment of wars (and other violent conflicts) in a book called “Statistics of Deadly Quarrels”, published in 1960. Brian Hayes has written a wonderful article discussing Richardson’s work.
One of Richardson’s motivations for a quantitative study of violent conflicts was to understand if war was becoming more or less frequent. He concluded that “The collection as a whole does not indicate any trend towards more, nor towards fewer, fatal quarrels.”
A more recent paper (Martelloni et al, 2018), has a similar conclusion:
After normalizing the data for the global human population, we find that the number of casualties tends to follow a power law over the whole data series for the period considered, with no evidence of periodicity.
The dataset used to draw that conclusion is from Peter Brecke’s Conflict Catalog, and is the data used for the visualization here. Brecke assigns each conflict to a region, and on the interactive version here, if you hover with your mouse over a region name it will highlight all the conflicts in that region. Be careful about reading too much into the regional distribution, however, since there are certainly biases in the data. As Brecke’s paper accompanying the dataset states:
One of the early findings of this research effort was that if one restricts oneself to the nine original data sources mentioned earlier, one discovers a strong Eurocentric bias in the data, and an especially stark bias for the period prior to 1800. The Conflict Catalog attempts to at least in part correct this disparity as it moves towards completion.
It’s interesting to see from the visualization that the 18th century has relatively fewer conflicts, something that Brecke commented upon:
The relatively pacific 18th century is a puzzle. Comparably thorough data for other regions have not yet been entered into the dataset, but my translators for the Chinese and Japanese data have without knowing these findings commented to me that the 18th century had relatively few conflicts in those two well-documented countries.
Visualization type: connected dot plot
Data source: Conflict Catalog (Violent Conflicts 1400 A.D. to the Present in Different Regions of the World), by Peter Brecke, XLSX, 790 KB.
Technical notes: generated using d3; code
See also: War and Peace, Our World in Data