51. Maximum daily temperatures in central England since 1878
The Met Office has an amazing dataset of the mean daily temperature recorded in central England that goes back to 1772. The mean monthly data goes back to 1659, and is “the longest available instrumental record of temperature in the world”.
This heatmap is a visualization of maximum daily temperatures that goes back to 1878.
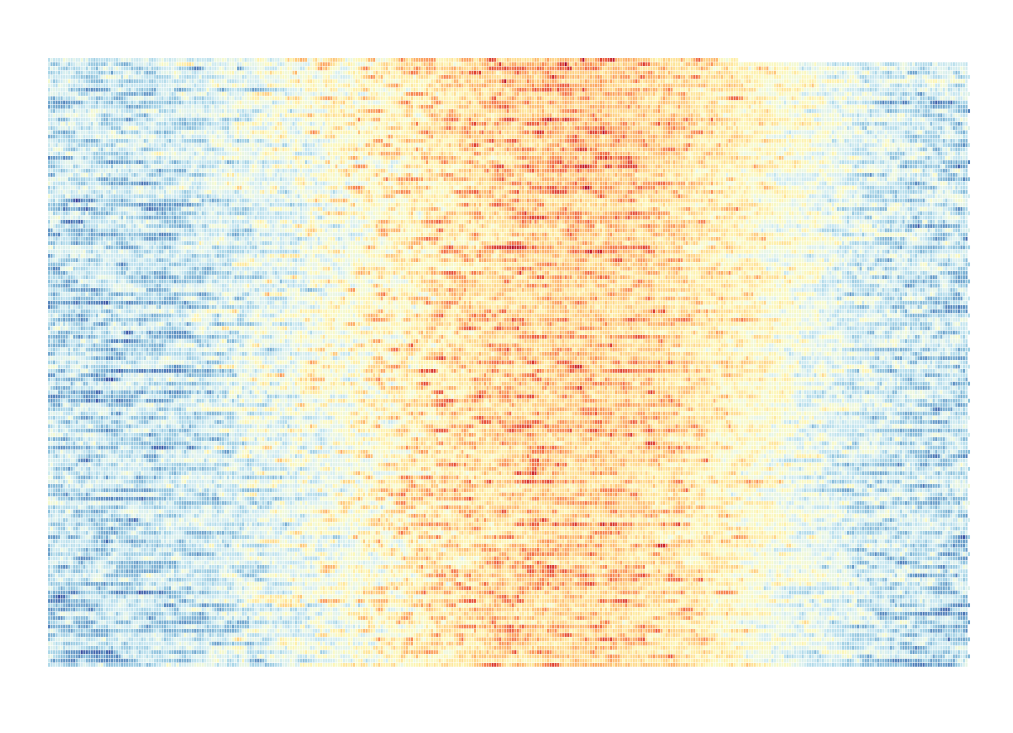
On the interactive version you can hover to see the recorded maximum temperature on any particular day.
You can see heatwaves quite clearly - the one in the summer of 1976, for example. You can make out the cold winter of 1962-63 too, where the maximum temperature hovered either side of freezing for weeks.
This isn’t the best visualization to see warming - the graph on the Met Office page for this dataset, and this plot by cavedave both show the warming trend over the last few decades.
Visualization type: heatmap
Data source: Met Office Hadley Centre observations datasets, space delimited text, 350 KB.