21. Voronoi football
In 2017 I visited MoMath in New York City. It’s full of interactive maths exhibits, and is well worth a visit (as I write, it is online only due to the public health situation).
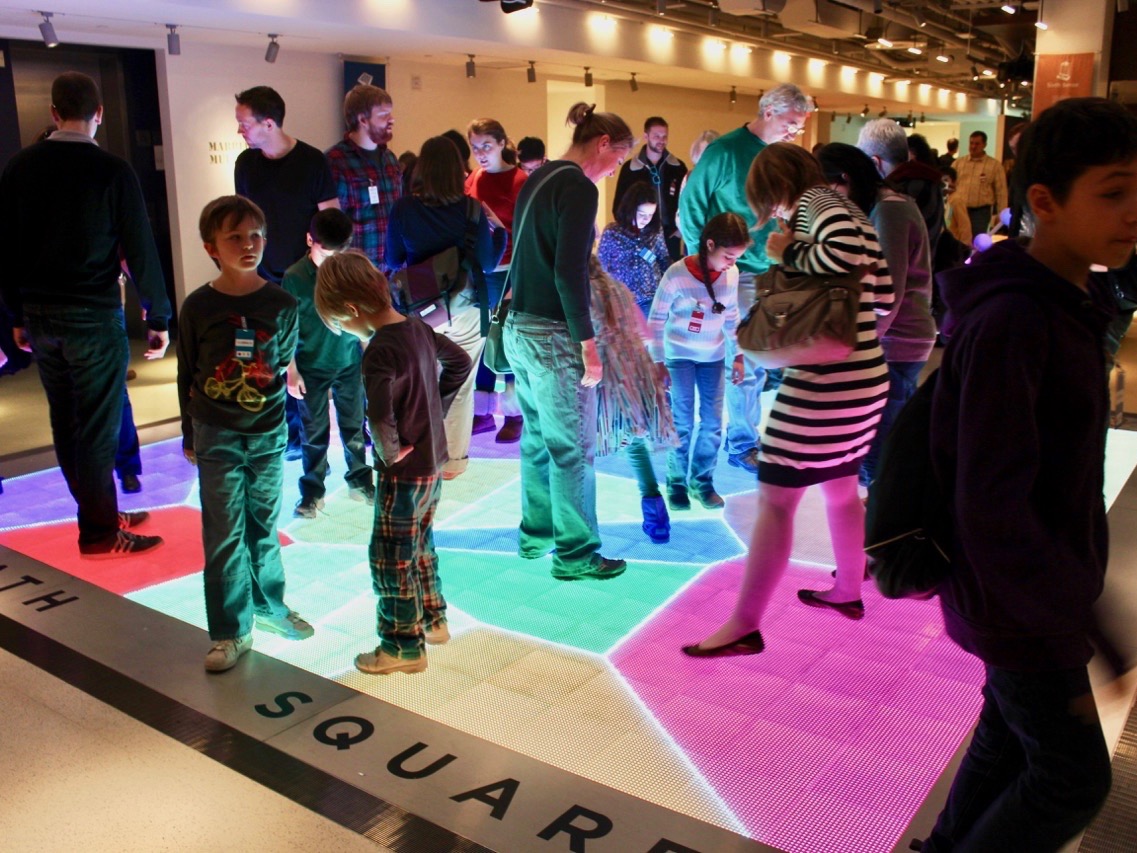
I particularly enjoyed watching kids run around on the Math Square, a square on the floor that responds to their steps. When I was there it was set up to draw large, brightly coloured shapes around where they were in contact with the floor.
These shapes are called Voronoi polgons. A Voronoi polygon is defined as being the set of points that are closer to one person than any other. (Note that the person is represented as a point in this case.)
This week’s visualization applies the same idea to a dataset of footballers’ movements during a match. Each player (and the ball) is a point in the plane, and we draw a Voronoi polygon for each of them. The points and polygons are animated to reflect their movements as the game is played.

[Click for an animated version.]
The ball is shown in white, and players are black dots in a polygon that is coloured by team.
The animation is played at 10 times the original speed. It’s quite hypnotic, and you can get a feel for what’s happening in the game, with the ball bouncing around, or being guarded by a group of defenders. And this is even though it’s just a few animated points and polygons.
Visualization type: animated Voronoi diagram
Data source: Magglingen2013, JSON, 284 MB
Technical notes: generated using d3; code
See also: Closest city, UK and Ireland; MoMath’s Math Square: